Multidistance CFT phase retrieval
This notebook runs an example of multi-distance CTF phase retrieval on simulation data in edf format.
Dataset setup
Install pyPhase. Then:
from pyphase import dataset
from pyphase import phaseretrieval
from pyphase import utilities

import matplotlib.pyplot as plt # for visualization purposes
from skimage import io
Define the project's name
name = 'holosim'
and set the path to the data
path = '/data/staff/tomograms/HoloSim'
Make sure that the data folders and files have the right format and structure.
You can have a look at the data
fig, ax = plt.subplots(nrows = 2, ncols = 2, figsize = (22, 15))

for i,row in enumerate(ax):
    for j,col in enumerate(row):
        file = '/home/d/PhasingProj/Data/HoloSimT/holosimt_{proj}_/holosimt_{proj2}_0001.tif'.format(proj=(i+1)*(j+1),proj2=(i+1)*(j+1))
        im = io.imread(file)
        col.imshow(im, cmap='gray')

Create a DataSet object
ds = dataset.ESRFID19(path,name)
Phase retrieval
Choose a phase retreival algorithm(link to list of algorithms) and create a retriever for the dataset, with the appropriate arguments
alpha =  1e-8
retriever = phaseretrieval.CTF(ds,alpha)
Select range of projections for which to retrieve phase
start = 0
end = 3
Run the phase retreival
retriever.ReconstructProjections(ds, start, end)
For each projection, a file named holosim_[version_predix]_000[n].edf with the retrieved phase and and a file named holosim_att__000[n].edf, with the retrieved attenuation, is created in the [path]/myProject_
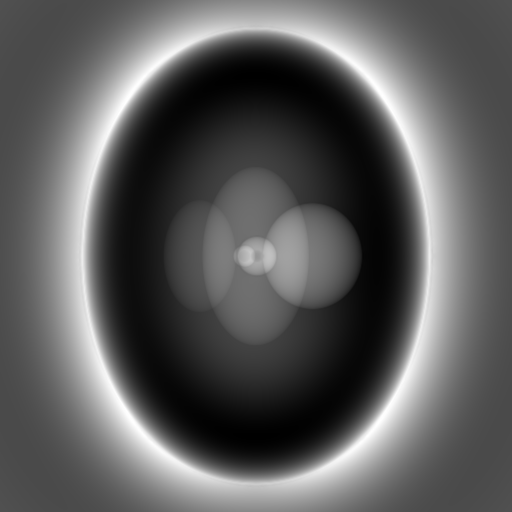
Visualizing the results
Look at the results by plotting the retrieved phase and retrieved attenuation for one projection
plt.figure(figsize = [8,8])
im = io.imread(path + 'holosim_/holosim_PP_0001.tif')
plt.imshow(imm, cmap = 'gray')
plt.figure(figsize = [8,8])
im = io.imread(path + 'holosim_/holosim_PP_att_0000.tif')
plt.imshow(imm, cmap = 'gray')
